🚀 Project Overview
This study focuses on understanding regional climate shifts through a data-driven approach. Using historical climate data from 1950 to 2023, I applied dimensionality reduction and clustering techniques to reveal trends in temperature, precipitation, and atmospheric heat transfer. The findings highlight evolving climate zones and increasing variability in regional climates.
📉 Dimensionality Reduction
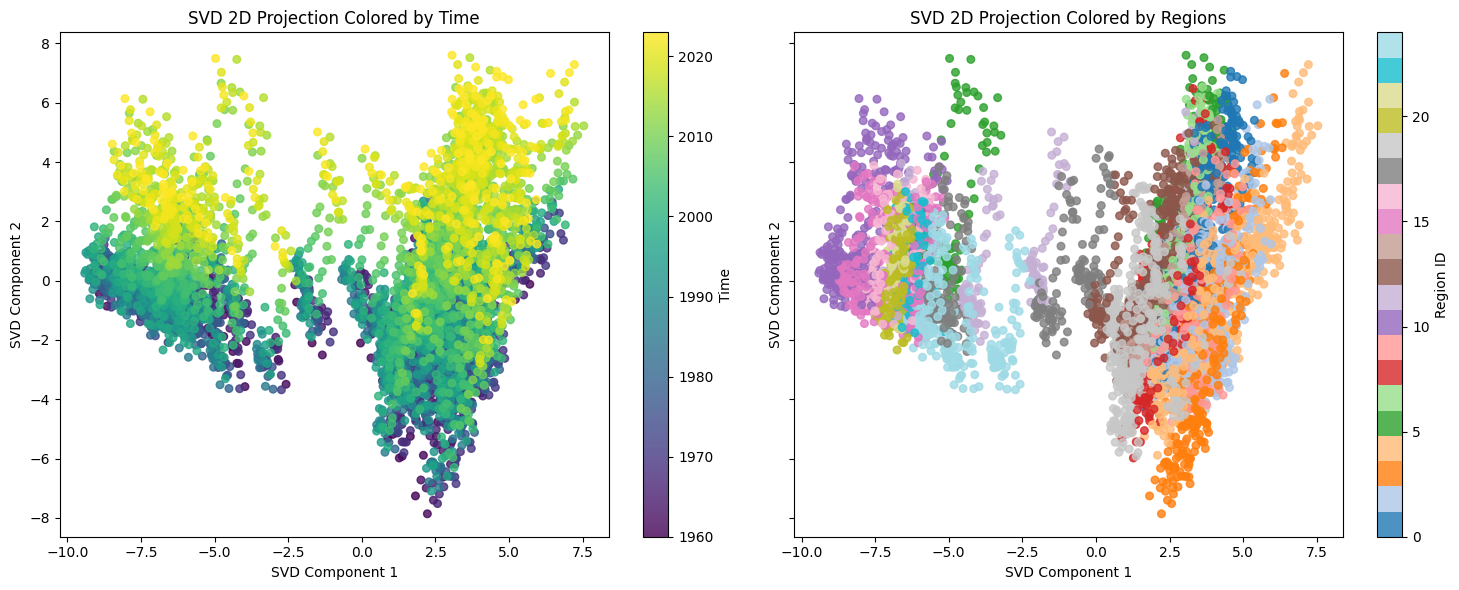
To extract the most relevant climate patterns, I applied Principal Component Analysis (PCA) and Singular Value Decomposition (SVD), reducing the dataset while retaining 98.7% of its variance. This allowed me to isolate the most influential climate trends over decades, making clustering techniques more effective and reducing the dataset from 36 variables to 15.
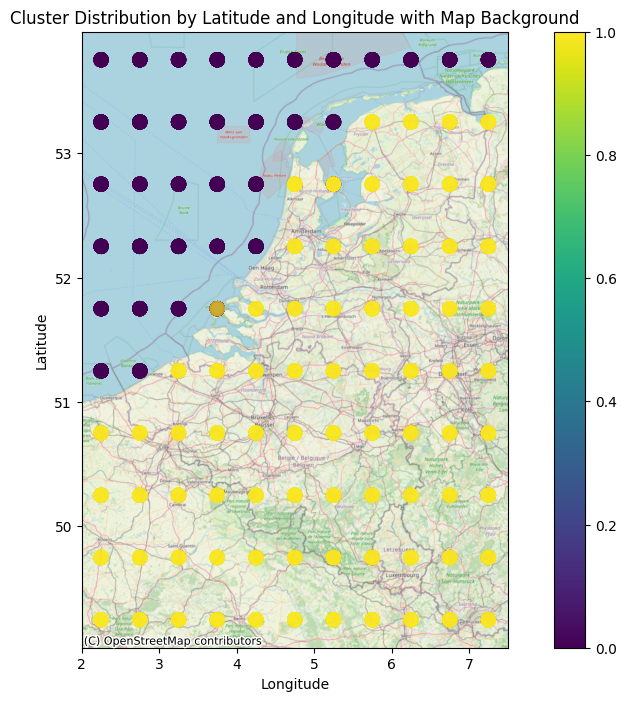
🔹 K-Means Clustering
K-Means clustering was used to define distinct climate zones by grouping areas with similar climate characteristics. Through optimization methods like the elbow method and silhouette scores, I determined the ideal number of clusters.
- Two-Cluster Model: Effectively separated land and oceanic climate zones.
- Six-Cluster Model: Provided more refined differentiation, highlighting deep sea, shallow sea, lowlands, and highlands.
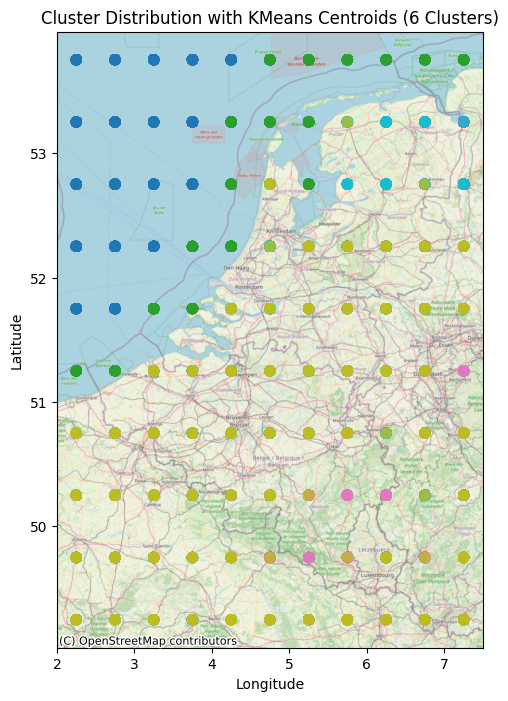
These findings show the various regions with different climates, giving confidence to the use of K-Means Clustering for further analysis.
🔹 Hierarchical Clustering
Hierarchical clustering was used to uncover nested climate zones, capturing both major and minor variations without requiring a predefined number of clusters. Post-2010, a large shift in the different climate regions is evident.
- Orange: Shallow sea and coastal areas
- Light Blue: Northern region of the Netherlands and just inside the western German border
- Grey: Center of Belgium and into the south of the Netherlands
- Purple: Areas of national parks just within the German border
- Green: National park areas of the Netherlands
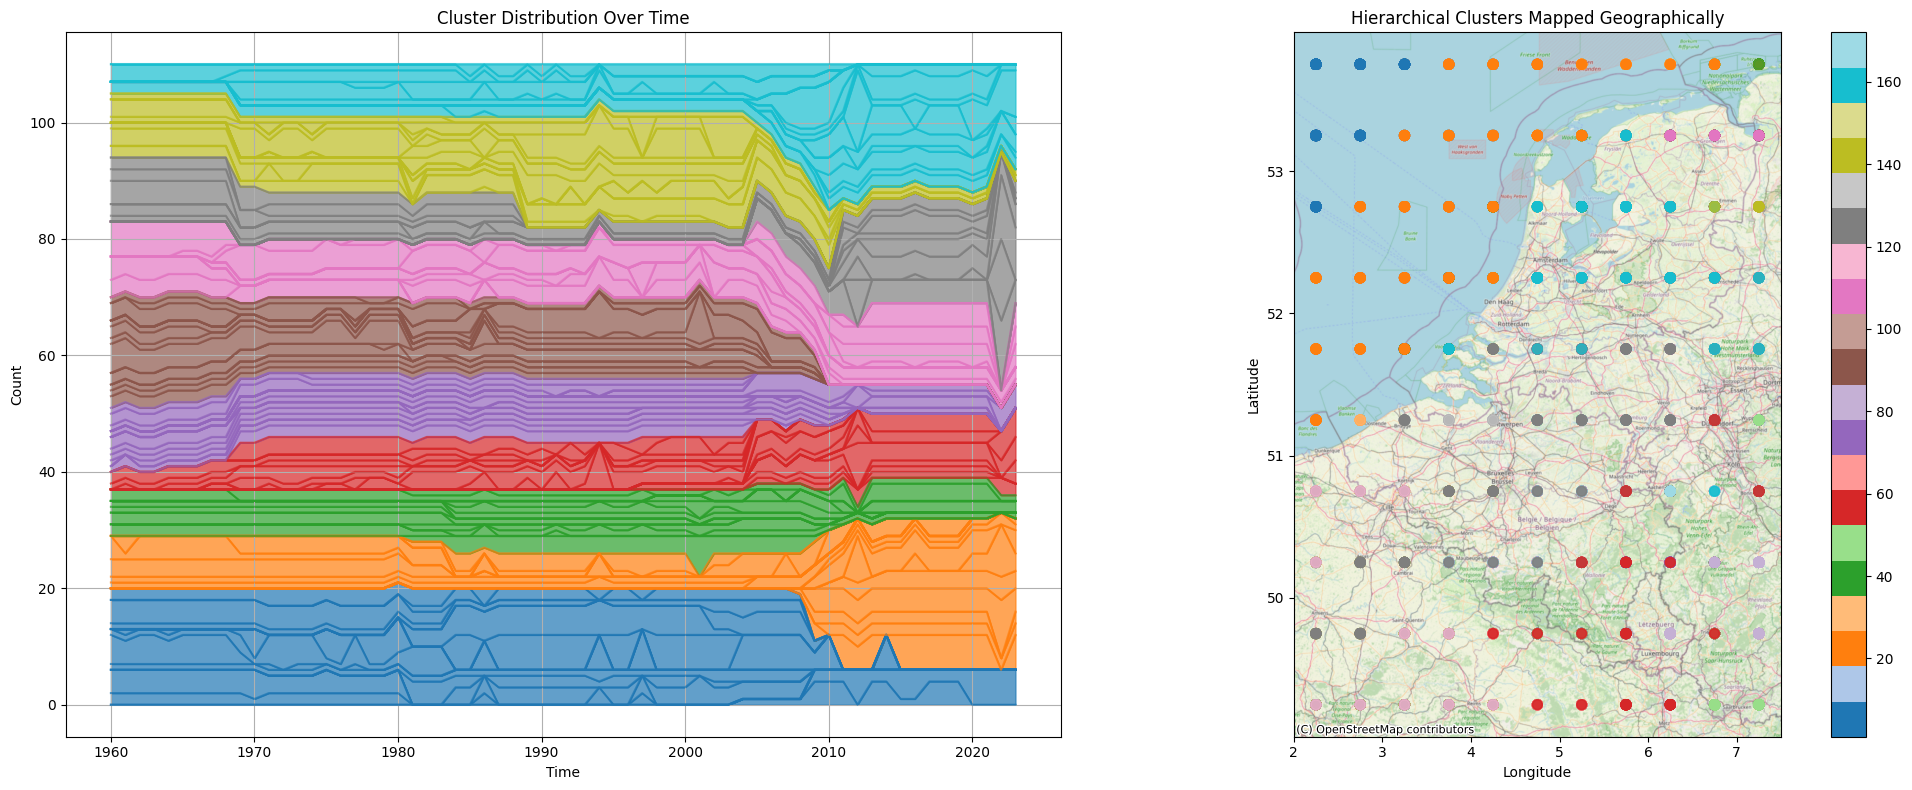
These results suggest that climate zones are not static—they evolve in response to urbanization, deforestation, and atmospheric changes. Hierarchical clustering provided a nuanced view of these transformations, allowing for better predictions of future climate trends.
🔗 Topological Data Analysis (TDA)
Traditional clustering methods assume predefined structures, limiting their ability to capture complex, non-linear relationships in climate data. To overcome this, I applied Mapper-based Topological Data Analysis (TDA), which preserves high-dimensional structures and identifies hidden patterns that might be missed by standard statistical methods.
🛠 How It Was Done
- Data Preparation: Used PCA-reduced climate features as input for TDA.
- Clustering Algorithm: Applied K-Means for local grouping of similar regions.
- Filter Function: Used temperature variability over time to structure the Mapper graph.
- Network Construction: Generated a topological network where nodes represent climate regions with similar trends, and edges indicate shared characteristics.
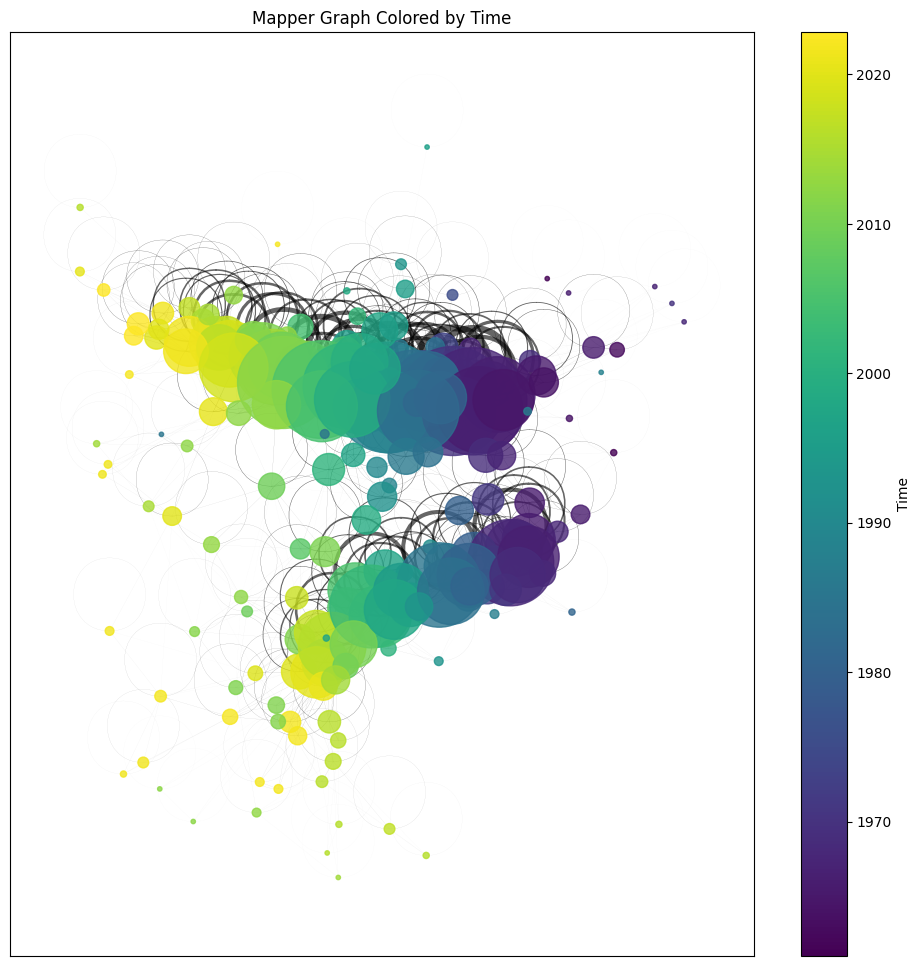
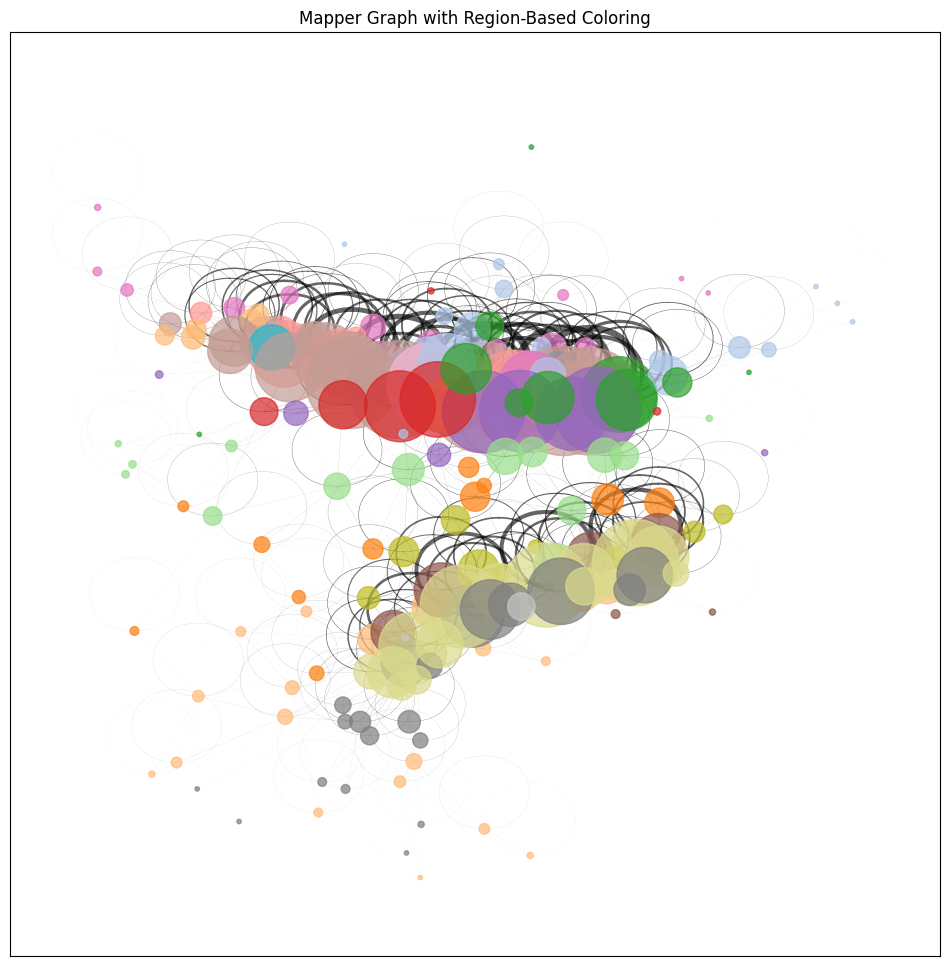
📊 Key Findings
- Distinct Climate Transitions: The TDA network revealed two dominant clusters, corresponding to land and oceanic regions, reinforcing previous K-Means findings.
- Climate Variability Hotspots: Post-2020, previously stable regions fragmented into smaller, more irregular clusters, indicating increasing unpredictability.
- Climate Shift Detection: The TDA graph suggested that climate boundaries are shifting, with coastal areas experiencing greater variability in response to oceanic warming.